How to use BigQuery
Follow these instructions to set up BigQuery console and to run your first query, for free.


BigQuery SQL console setup
Getting started with BigQuery is easy and free. Follow the instructions below to get started.
- Go here: https://console.cloud.google.com/bigquery
- Log in with your email - You'll need a gmail account.
- Create your first project - Call it "My Project" or whatever you like. You can set Location to "No organization". Click "Create".
- Enable the BigQuery API for that project.
- You're in!
- Click "CREATE SQL QUERY"
- Copy / paste the code below into the console and click “RUN”
SELECT title, sum(views) views
FROM `bigquery-public-data.wikipedia.pageviews_2024`
WHERE DATE(datehour) > CURRENT_DATE() - 1
AND wiki in ('en','en.m')
GROUP BY 1
ORDER BY 2 desc
LIMIT 100;
Your screen should look something like this.
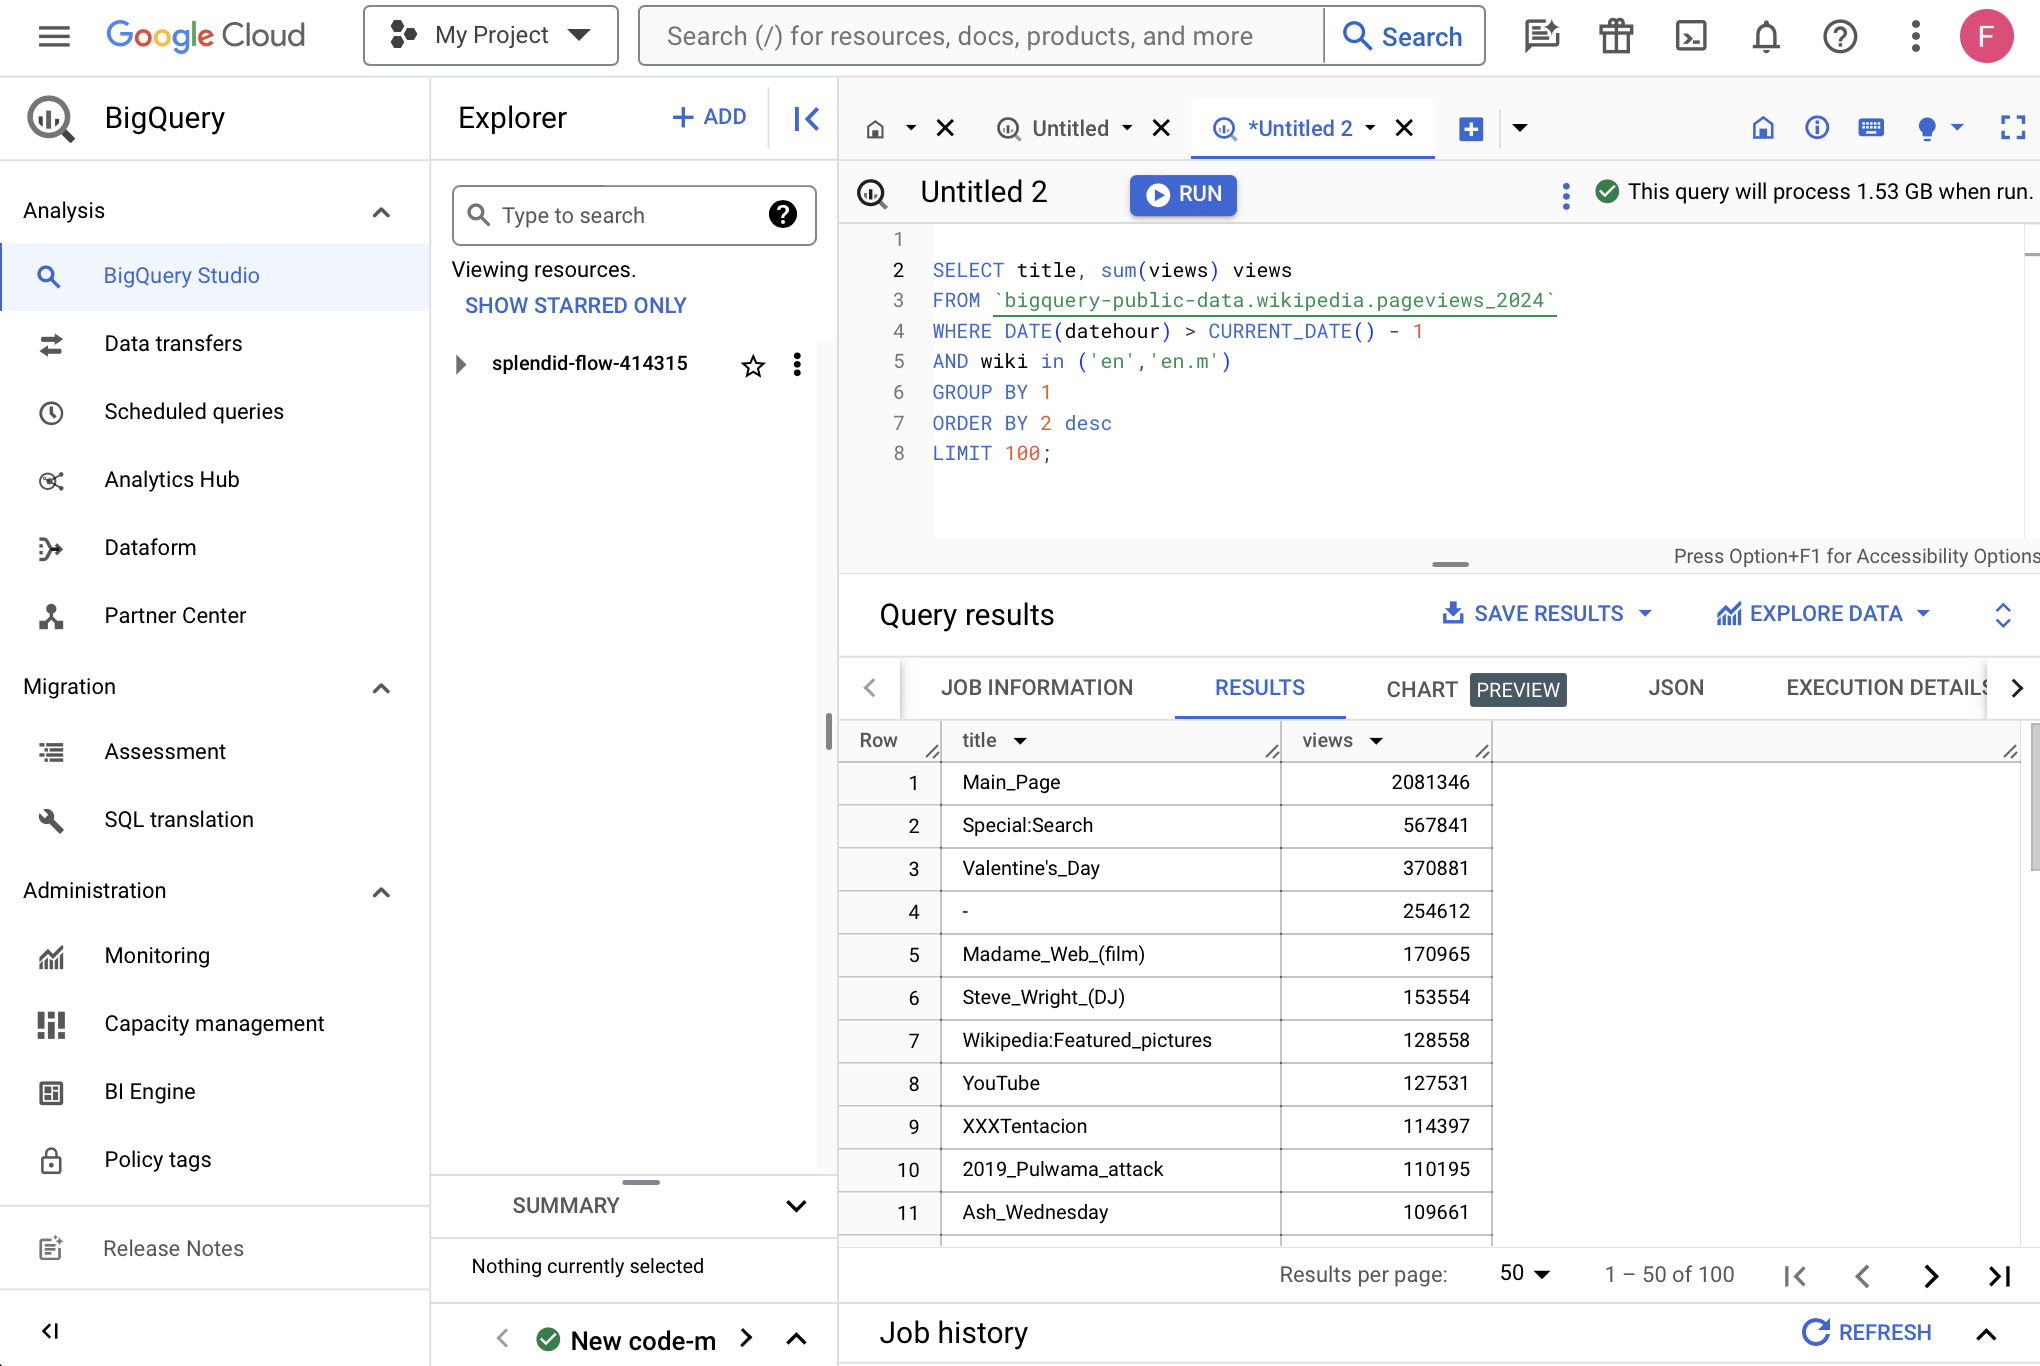
You just queried a database to generate a list of yesterday's most popular Wikipedia pages.
Don't worry about what that code is doing for now. (If you really want to know, start here.) Let's back up for a second.
What is BigQuery
BigQuery is a data warehouse. It's exactly what it sounds like: a place where data is stored and an interface through which you can access that data.
BigQuery is one of several data warehousing tools including Amazon Redshift, Microsoft Azure, Databricks, and Snowflake that companies use to store datasets such as account information, inventory, order history, analytics & engagement data, and anything else that might be useful to track user or customer histories and run a business.
We're using BigQuery in these tutorials for a few reasons. For one, there is an active team maintaining the product so it's not going anywhere. And BigQuery is packed with cool features which reveal themselves over time, such as easy integrations with Google Analytics and Google Sheets, CSV ingestion, and new machine learning features that let you make predictions with SQL.
Also, BigQuery is a great place to learn because it is very possible that today or in the future you will work at a company that runs on Google's cloud infrastructure, and so you might use BigQuery to do analysis on the job.
But the main reason I use BigQuery in the tutorials found across this site is because it comes out of the box linked to hundreds of public datasets that are free to query. BigQuery is a fantastic place to learn because the data is already connected to your interface, and this data is packed with insights waiting to be revealed through your code.
Public datasets
BigQuery has hundreds of them. These datasets are uploaded and maintained by governments, nonprofits, and for-profits committed to keeping data open and free. Some datasets are massive and up-to-date, and some of them look a lot like what you might query in a professional setting. But there's a lot of junk in here, too.
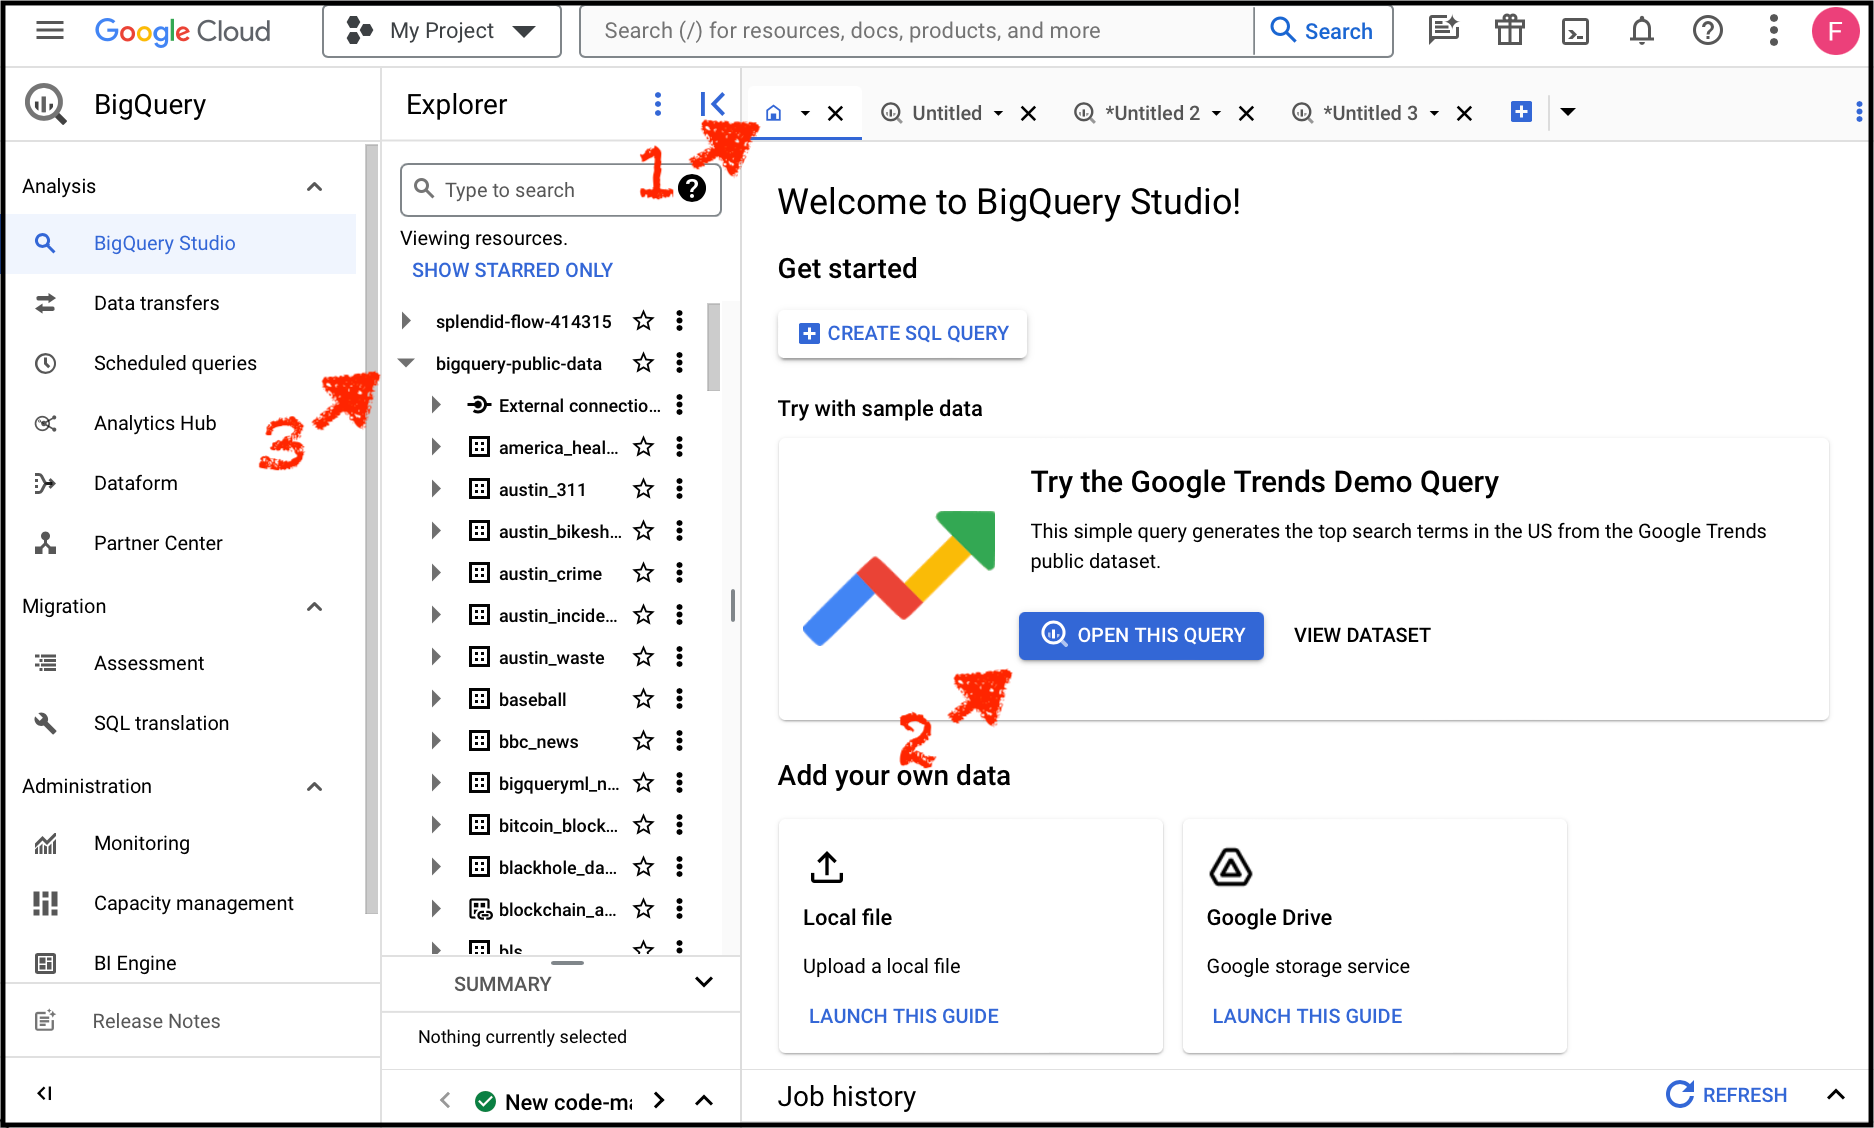
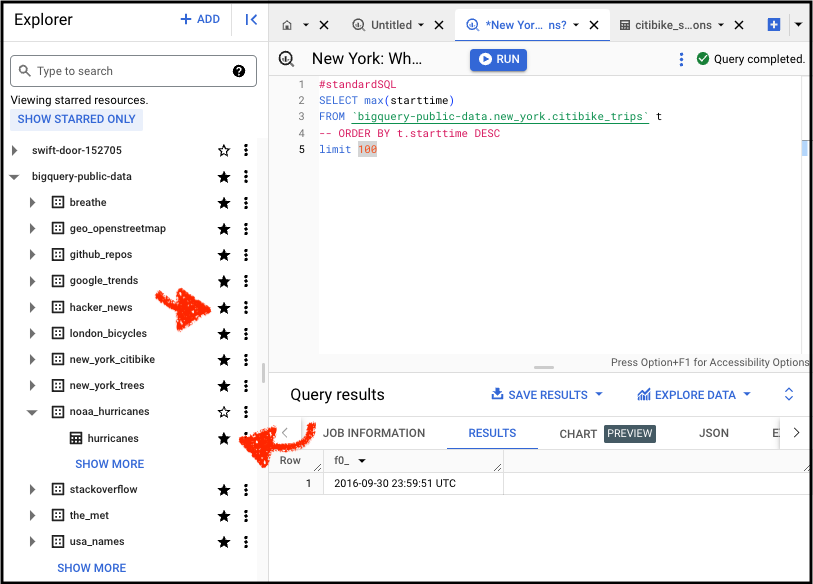
If you followed the instructions at the top of this post, then you already queried a publicly available dataset: Wikipedia. To show all public datasets 1. go to your home tab, 2. click "OPEN THIS QUERY", and 3. your explorer will populate with hundreds of datasets that you can query.
You'll see Google Trends in here, and Wikipedia, and lots more. Read about my 10 favorite BigQuery datasets here. These 2 are at the top of the list:
- Stack Overflow – Questions, answers, upvotes, accounts, and more. This is one of the realest datasets available through BigQuery because it features a users table and tables for user actions, so you can analyze user histories and aggregate them to understand things like activation & retention rates and funnels.
- NYC Taxi Fares – 30 million rides per year, including fares, tips, and pickup and dropoff locations. We use this dataset in the tutorial on creating histograms with SQL.
Public data is great, but your own business data will always be the most useful data to query. Learning in-house where you work is the best place to learn because the data reflects business problems that you're familiar with. And you will be intrinsically motivated to grind through the learning curve to extract insights. So if you have a job, do everything you can do to learn on the job!
But not everybody has this opportunity. This is why public data can be extremely helpful.
Browse datasets
Click around and find out.
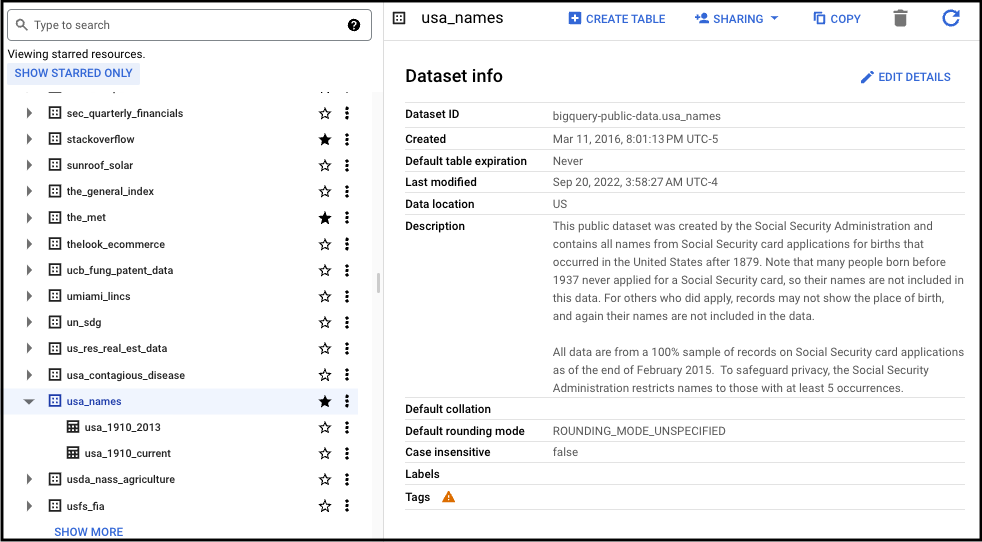
Now that you've set up your account and you're in the BigQuery SQL client, click on a dataset to see “Dataset info”. Here you can see useful info about what's included in the dataset, such as “Last modified” which tells you how current the data is. This is one of the first things I look at when considering a dataset to query because it's important to know and communicate to your stakeholders if you are querying stale data. “Description” is another useful dataset property. Here you can read a basic overview of how the data was collected and what's included.
Once you've found a dataset that's interesting to you, click the star to favorite it and easily find the dataset in the future.
Split your screen
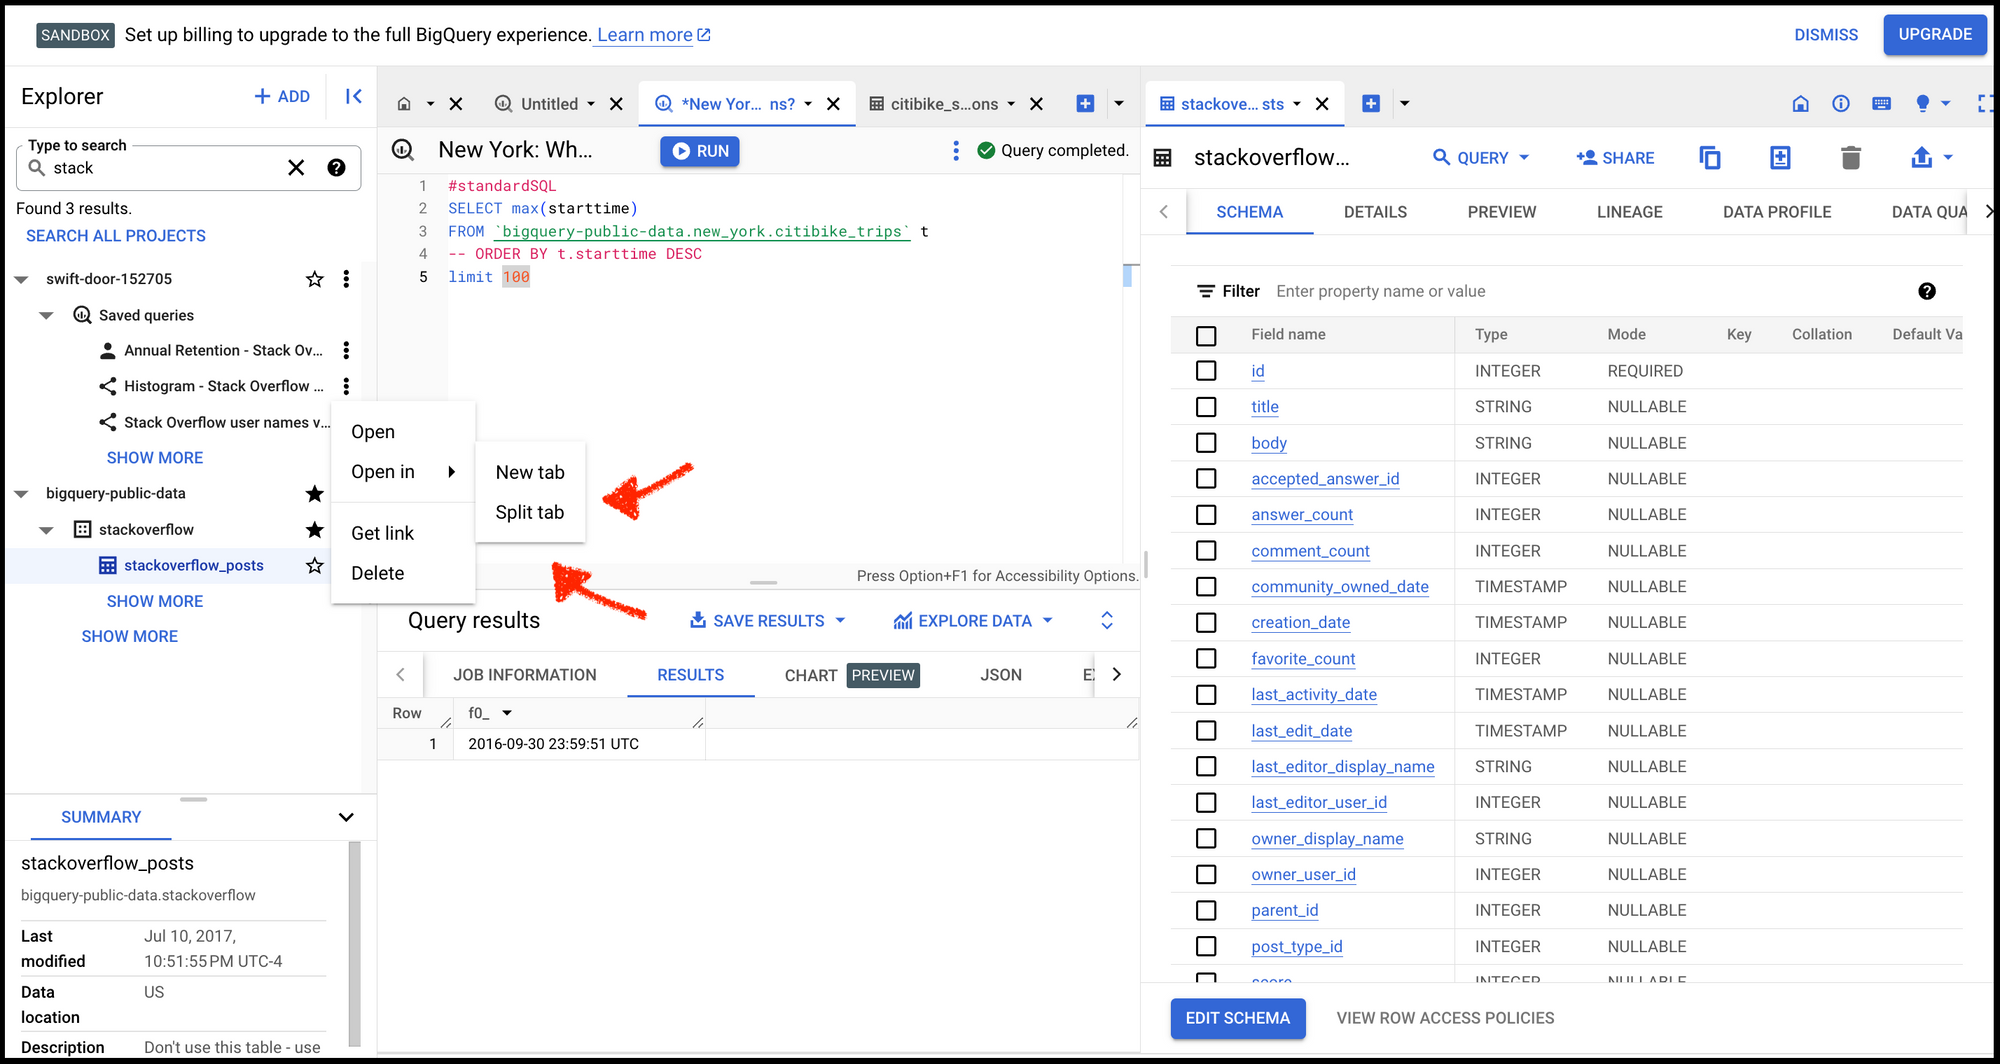
Open tables in a “split tab” so that you can write SQL and see a table's schema at the same time. This helps to prevent context switching between tabs. Now you know why software developers love big screens.
Databases & tables
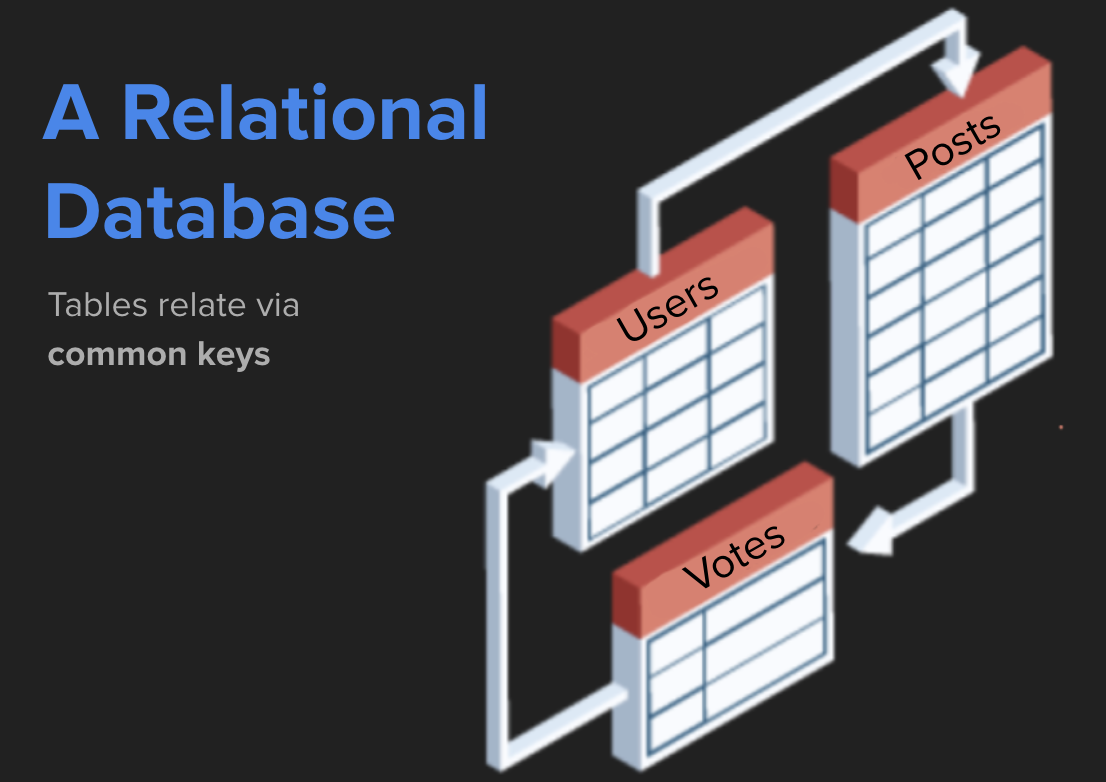
BigQuery is a data warehouse that contains relational structured data. The data is relational because tables relate to one another. For example, in the stackoverflow database you'll find tables like users, votes, and posts, all of which can be joined together through a common key, such as a unique identifier or a date, to build more complex datasets and draw insights.
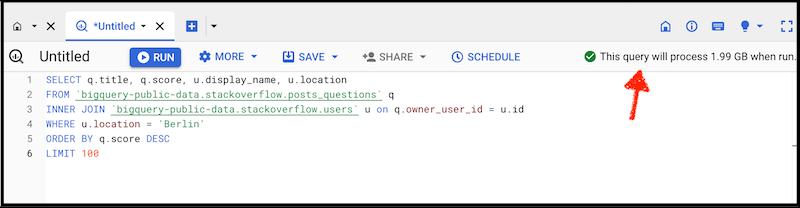
In the Stack Overflow database, for example, we can query the questions table (post_questions) to find the highest scoring questions, and then join that result to the users table so we only return results where the question was asked by users from Berlin.
Here's the query.
SELECT q.title, q.score, u.display_name, u.location
FROM `bigquery-public-data.stackoverflow.posts_questions` q
INNER JOIN `bigquery-public-data.stackoverflow.users` u on q.owner_user_id = u.id
WHERE u.location = 'Berlin'
ORDER BY q.score DESC
LIMIT 100;
Top questions by Stack Overflow users from Berlin
We never could have returned this result by looking just at a single table because no one table includes questions AND user location. We had to join the tables by the common key user_id. (Heads up that JOINs are beyond the scope of SQL 101, so don't worry about it if it doesn't stick just yet.)
Here's what it looks like in BigQuery when you put it all together.
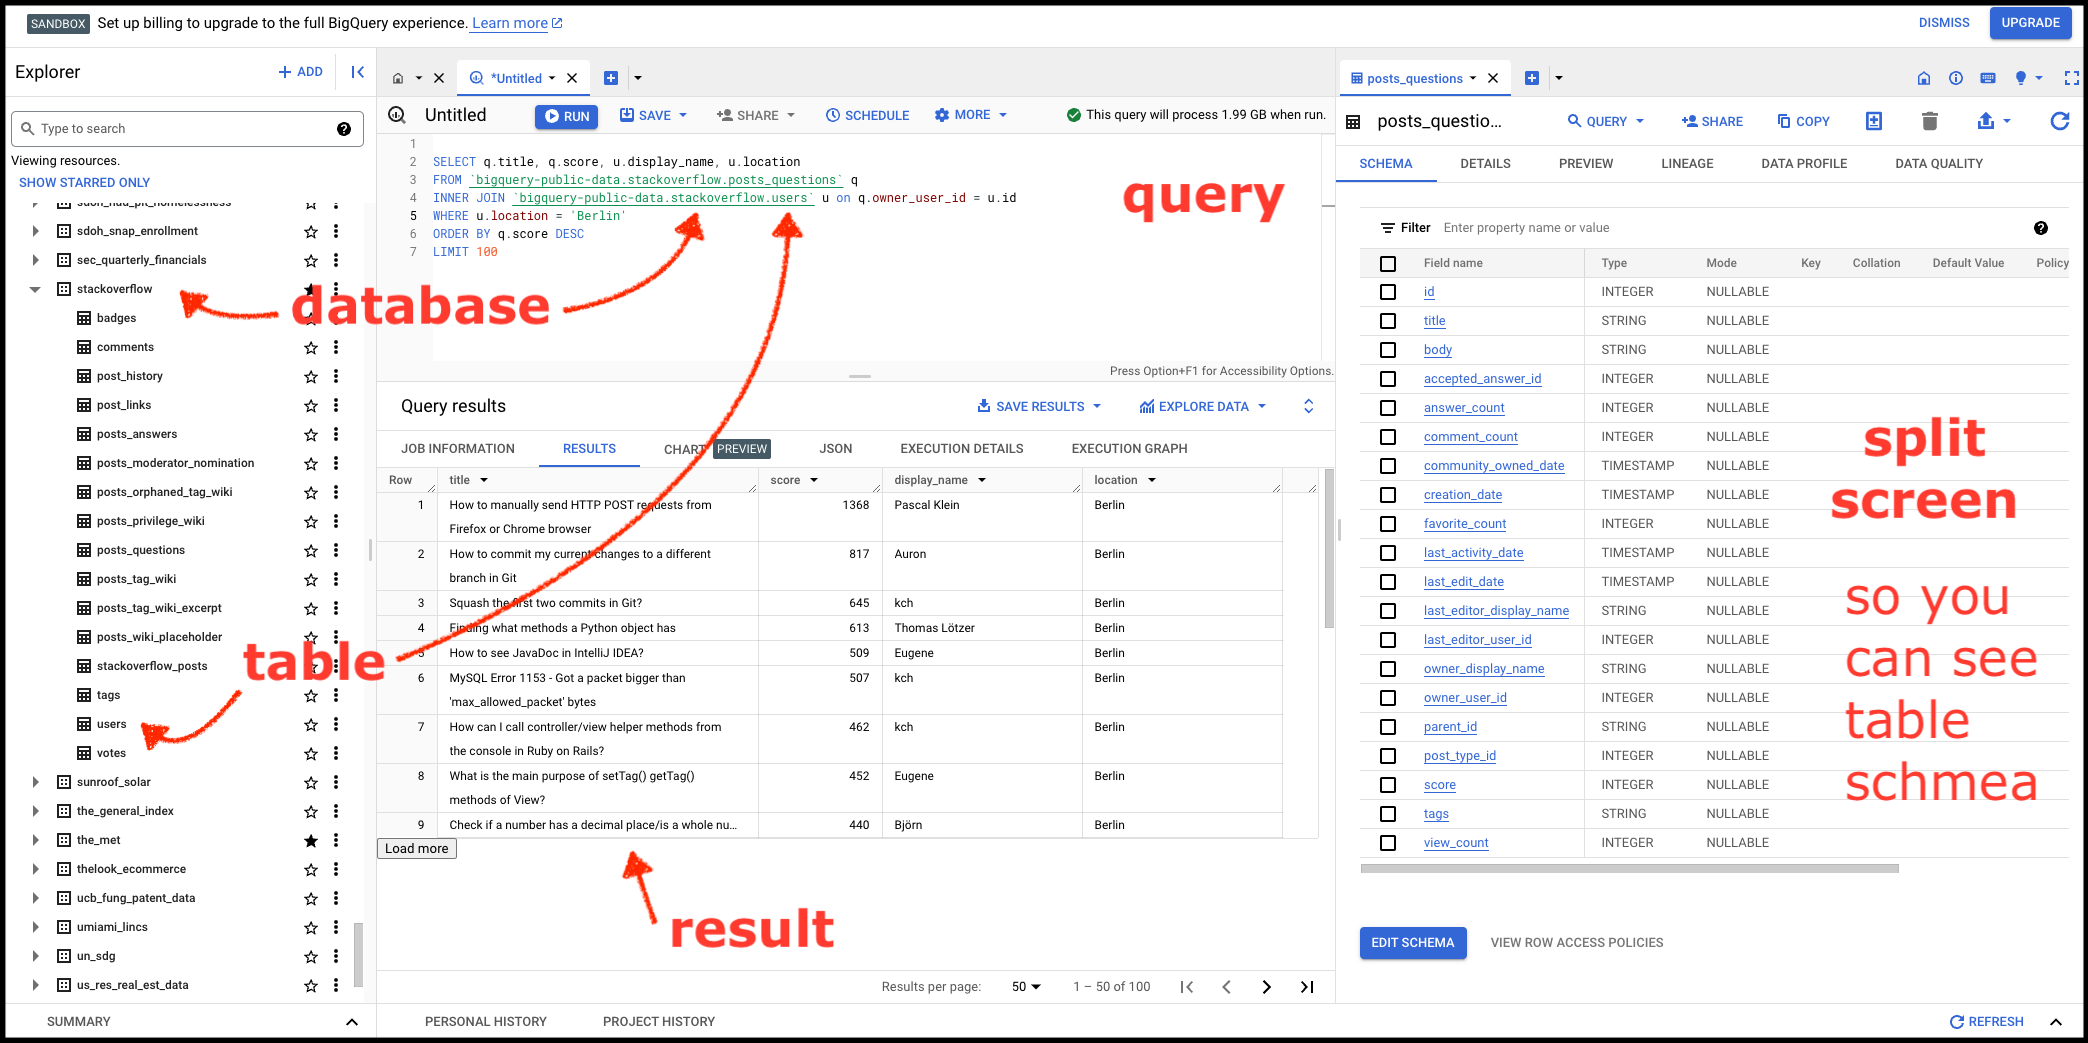
Yep, that's the highest scoring question by a user whose profile includes the location Berlin. Here is the question: https://stackoverflow.com/q/4797534/896802
Rows & columns
Tables are just like CSVs or spreadsheets. Every row is a record. Every column is a trait or a property.
In a true relational database there should only ever be 1 row for a specific entity. If it us a users table, then there should be only 1 row per user, and that user would be identifiable by a specific ID — their user id.
User ID is a column, property, or trait (these words all mean the same thing). A users table might also include columns like signup_date, last_updated_date, permissions, etc. These are all traits that describe the user and other users, and as we'll soon see, we can group by traits like this to ask questions like “How many users were created in the last year.”
SQL is way better than Excel and Google Sheets
SQL is more powerful than Excel in a hundred ways. For one, you can't destroy your dataset with a sneeze. Unless you're writing to the database (we are not), you're never actually modifying the data! We're just reading it, and we're modifying the presentation layer with code. It's a much more safe and powerful way to interact with data.
SQL is how the internet works
The entire web is powered by SQL.
Human analysts aren't the only "clients" who query databases. So do applications like websites, mobile apps, and APIs. When you use a search engine you write a human-readable query, such as "what's the weather", that generates real SQL under the hood to crawl through a database and return a result.
In addition to reading from a database, SQL is used to write to databases. As an analyst, we might run a query to read the most popular sites on Wikipedia, but when you edit a Wikipedia page and click "save" then SQL might be working under the hood to save the updated article to the database.
For now, we're just analysts. We're going to be writing SQL to read and transform data to extract insights.
Manage costs
If you hang around engineers long enough you'll hear them throw around the word "expensive" when talking about computational processes or queries. "Expensive" doesn't necessarily mean it will cost you lots of money, though in some cases it might also mean that. Queries are expensive when they take a while to run or when there might be a more efficient way to produce an equivalent result.
In BigQuery you can see how much your query costs before you hit "Run". This can help you modify your query to make it more efficient so you don't waste your free 1 TB per month. 1 TB equals 1,000 GB, which is plenty for our purposes. I've been hammering this system pretty hard and I haven't yet hit my limit.
OK, now you're ready to start writing queries.
See the next tutorial: SELECT FROM WHERE - Basic Queries
More on this website:
 Sam Brand
 Sam Brand
 Sam Brand